
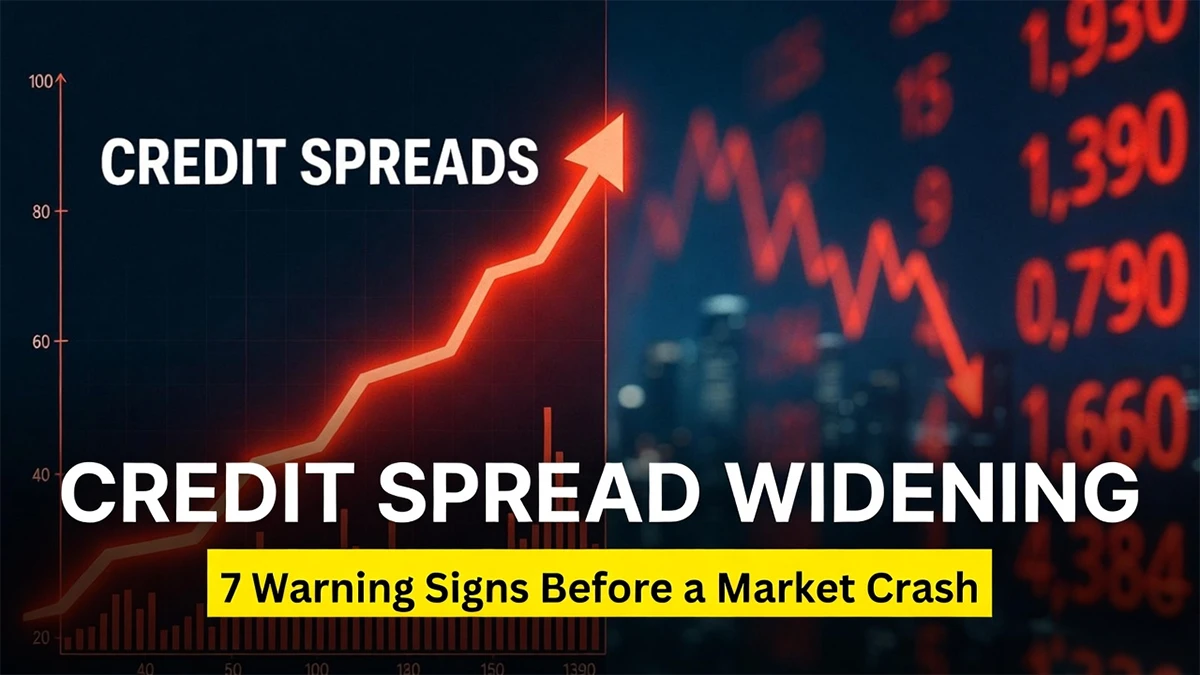
In early 2026, global credit spreads are doing something they haven’t done in years: moving fast and in the wrong direction for corporate borrowers.
Credit spread widening has been building since early 2025. The ICE BofA U.S. High Yield OAS hit 340 basis points in March 2025. That’s up 80 basis points from January 2025 lows. For pension funds, bond portfolio managers, and CFOs planning debt issuance, credit spread widening is the signal that changes everything else.
What Is Credit Spread Widening? Credit spread widening occurs when the yield gap between corporate bonds and equivalent U.S. Treasury bonds increases, signaling that investors are demanding higher compensation for credit risk. It is one of the bond market’s most reliable early-warning indicators for recessions, equity sell-offs, and tightening financial conditions.
This guide covers what widening spreads actually signal, what’s driving the 2025–2026 episode, and what investors in the US and global markets should do at each stage.
What Are Credit Spreads and How Do They Work?

A credit spread is simple math. Credit spread widening happens when that gap grows. Take a corporate bond yield and subtract the Treasury yield at the same maturity. The gap is the spread.
Formula: Spread (bps) = Corporate Bond Yield − Treasury Yield × 10,000
If a 10-year corporate bond yields 6.2% and the 10-year Treasury yields 4.5%, the spread is 170 basis points. One basis point equals 0.01%. So 100 bps equals 1%.
That gap represents the extra return investors demand for taking on corporate default risk instead of holding a risk-free Treasury.
Two Markets, Two Risk Worlds
Not all spreads are the same. The market splits into two very different signals.
| Category | Current Spread (2025–26) | What It Signals |
| Investment Grade (IG), BBB and above | ~100 bps (Barclays, Mar 2025) | Below 35-year avg of 130 bps. Historically tight. |
| High Yield (HY) / Junk, BB and below | ~340 bps (LPL Research, Mar 2025) | Rising. Historical avg ~528 bps. Not crisis yet. |
| CCC / Distressed | Widening sharply in 2025 | Near 20-year average. Deterioration concentrated here. |

IG widening signals systemic concern. HY widening is a leading indicator of market stress. CCC widening means the default cycle may already be starting in specific pockets.
The indexes to watch: the ICE BofA U.S. High Yield Index OAS, the Bloomberg U.S. Corporate Bond Index, and the Federal Reserve Economic Data (FRED) for live HY OAS and IG OAS spread data.
What Credit Spread Widening Actually Signals
Credit spread widening sends three core messages at once.
- Rising default risk perception: investors fear corporate earnings will weaken and more companies will struggle to service debt.
- Flight to safety: capital moves from corporate bonds toward U.S. Treasuries, pushing Treasury prices up and yields down.
- Tighter financial conditions: higher corporate bond yields mean more expensive borrowing for every company planning a debt issuance.
Credit spread widening context matters: the speed and magnitude of the move matters more than the absolute level.
The 300 bps Rule: The Threshold Nobody Talks About

This is the metric most financial media skip entirely.
Federal Reserve research shows that HY spread widening of more than 300 basis points from a recent low is a strong recession signal. Every major U.S. recession since the 1970s was preceded by this move.
| Crisis | Peak HY Spread | Lead Time Before Equity Peak |
| Dot-Com Bubble (2000–02) | ~1,100 bps | Widening began ~12 months before S&P peaked |
| Global Financial Crisis (2007–09) | ~2,100 bps | Widening started mid-2007, S&P peaked Oct 2007 |
| COVID-19 (Feb–Mar 2020) | ~1,100 bps | 300 bps to 1,100 bps in just 5 weeks |
| 2022 Fed Rate Hike Cycle | ~600 bps | IG widened sharply as Fed hiked 425 bps in 12 months |
| 2025 Tariff Shock (current) | ~340 bps | Post-inauguration widening. IG +8 bps in one day (April 4). |
Today’s widening of ~80 bps from January 2025 lows has not yet triggered the 300 bps rule. But the direction is established. Understanding how credit cycles build and eventually break helps put this in context: credit cycles drive expansion, peak, and contraction phases across global financial markets
Credit markets consistently lead equity markets by 3 to 12 months in every major downturn since 1990. Bond investors price in default risk before equity valuations reflect the earnings impact.
What’s Actually Driving the 2025–2026 Widening
The April 2025 Tariff Shock: A Live Case Study

The current credit spread widening episode has a clear trigger.
On April 2, 2025, the Trump administration announced sweeping “reciprocal tariffs” across trading partners. By April 4, IG spreads widened 8 basis points in a single session. That was the largest one-day move since the Spring 2023 banking crisis.
The transmission mechanism runs in a straight line: tariff announcement → corporate earnings uncertainty → analyst downgrades → institutional bond selling → yields rise → spreads widen → financial conditions tighten.
Worst-performing IG subsectors: cable/satellite (minus 95 bps excess return), railroads (minus 87 bps), and energy (minus 85 bps). RSM raised its U.S. recession probability from 15% to 20% within two weeks of the announcement.
The Bifurcation Nobody Is Discussing

Actually, the number that matters more here isn’t the headline HY OAS. It’s what’s happening inside the index.
BB-rated bonds had spreads tightening through much of 2025. CCC-rated bonds had spreads widening materially. This bifurcation means the market is not pricing a systemic collapse. It’s pricing idiosyncratic default risk concentrated in the weakest borrowers.
Credit spread widening analysis at the index level can be misleading. Sector-level distress is hidden inside the average.
Private Credit: The Hidden Stress Point

The global private credit market sits at about $2 trillion. In 2024–2025, a chain of defaults emerged: Thrasio (February 2024), Tricolor (November 2024), and First Brands collateral fraud (January 2025).
By early 2026, Blue Owl had gated withdrawals from a retail credit vehicle, Apollo BDC cut payouts and marked down assets, and Blackstone’s private credit fund raised its repurchase cap to meet roughly $2 billion in redemptions.
Losses are migrating outside traditional banks. Regulatory oversight doesn’t fully cover this space. That’s the liquidity uncertainty that makes a widening episode harder to contain than it looks on the headline spread number.
When private credit stress combines with rising consumer delinquencies and the 694 U.S. corporate bankruptcies in 2024 (the highest in 14 years, per LPL Financial), the early-warning chain becomes visible.
Consumer delinquencies rise, commercial real estate stress builds, corporate bankruptcy filings surge, and then public credit markets catch up. This is how systemic financial risk spreads through interconnected markets and why contagion builds faster than most investors expect
The Tiered Investor Playbook for Spread Widening

Understanding credit spread widening at each stage of severity changes the investment decision entirely. This is where most articles stop at vague advice. Here’s a structured framework.
| Widening Level | What It Signals | Investor Action |
| Tier 1: +25 to 75 bps | Correction scare, repricing event | Reduce lower-quality HY. Rotate from CCC to BB. Add IG floating rate notes. Monitor CDS for confirmation. |
| Tier 2: +75 to 200 bps | Elevated stress, recession probability rising | Increase IG quality. Reduce spread duration. Hedge via CDS. Build Treasury allocation. Avoid new-issue HY. |
| Tier 3: +200 to 400+ bps (300 bps rule triggered) | Recessionary signal. Preceded every U.S. recession since 1970. | Flight to quality: Treasuries and cash. Short credit derivatives. Wait for panic peak to buy distressed credit. Review private credit exposure urgently. |
Where are we now (March 2026)? HY OAS at ~340 bps means we’re at the top of Tier 1 and approaching Tier 2. LPL Research assessed this as a correction scare, not recession scare, as of March 2025.
But the private credit stress signals and bankruptcy uptick suggest Tier 2 conditions are forming underneath the surface.
Watch level: If HY OAS crosses 450 bps, Tier 2 is confirmed. If it crosses 550 bps, Tier 3 risk is growing.
For portfolio positioning across sectors:

- High-quality IG corporates (A/AA rated): Overweight. Best risk-reward if widening stays non-recessionary.
- BB-rated High Yield: Neutral to slight overweight. Spreads already tightening here.
- CCC-rated / Distressed HY: Underweight. Spreads near 20-year average with high default risk if recession arrives.
- IG Floating Rate Notes (FRNs): Overweight. Lower spread duration provides cushion. VanEck data shows IG FRNs outperformed fixed-rate IG in every major widening cycle from 2015 through 2022.
- U.S. Treasuries: Increase. Flight-to-quality trade benefits as spreads widen.
- Private credit / BDCs: Caution. Gating risk, payout cuts, and mark-downs in 2025–26 require thorough due diligence before any new allocation.
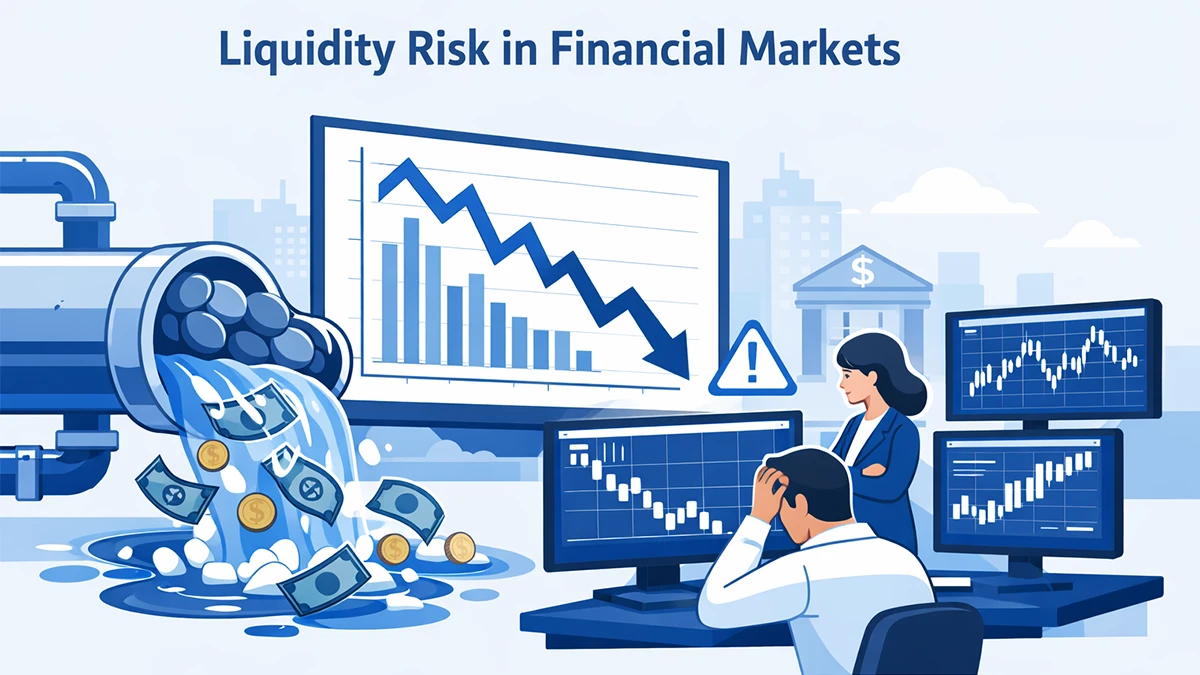
For deeper context on how liquidity stress transmits into pricing and institutional behavior, liquidity risk builds in financial markets through warning signs that institutional investors closely monitor
Frequently Asked Questions
What does credit spread widening mean?
Credit spread widening occurs when the yield gap between corporate bonds and equivalent U.S. Treasury bonds increases. It signals that investors are demanding higher compensation for credit risk, reflecting growing concern about corporate defaults, economic slowdowns, or financial market stress.
Is credit spread widening a recession signal?
Not always immediately, but historically it has been a reliable leading indicator. HY spread widening of more than 300 basis points from recent lows has preceded every U.S. recession since the 1970s. Current widening in 2025–26 remains below that threshold, but the trajectory requires monitoring.
What causes credit spreads to widen?
Expansion phases lift stocks, compress bond spreads, and support real estate. Contraction phases do the opposite. High-yield bonds and cyclical equities are the most sensitive. Government bonds typically rise in price during contractions as investors move to safety.
How does credit spread widening affect stocks?
Credit spreads and equities are closely correlated. Widening spreads typically precede or coincide with equity market sell-offs. Credit markets often lead equities by 3 to 12 months in signaling deterioration, based on State Street 30-year historical data.
Are wider credit spreads better for investors?
It depends on your position. For existing bondholders, wider spreads mean falling prices and potential losses. For new investors, wider spreads offer higher yields and potential upside if the economy stabilizes. Widening episodes are often tactical entry points in high-quality IG credit.
Do credit spreads widen during a recession?
During the GFC (2008–09), HY spreads peaked above 2,100 bps. During COVID (2020), they hit ~1,100 bps within five weeks. Even moderate recessions see HY spreads exceed 600 to 700 bps. Today’s levels around 340 bps remain well below recessionary territory.
The Honest Picture for 2026
The final word on credit spread widening: the bond market can’t be spun. Credit spread widening is the most honest signal in finance, and right now it’s telling a specific story: we’re past complacency, but not yet in crisis.
The real risk isn’t a single headline number. It’s the convergence: a trade policy shock feeding into borrowing cost increases, private credit stress sitting outside traditional regulatory oversight, AI-driven debt surge from historically fortress balance sheet companies like Meta, Google, and Oracle (which collectively raised over $100 billion in Q4 2025 IG issuance alone), and a delinquency chain building in consumer credit.
J.P. Morgan’s 2026 forecast puts IG spreads at 110 bps by year-end. That implies moderate widening, not collapse. But moderate widening from historically tight levels still means meaningful losses for long-duration IG holders.
Western Asset data from the April 2025 tariff shock showed that 8 bps of spread widening in one day translated to minus 59 bps in excess return.
Monitor credit spread widening weekly via HY OAS. Use FINRA TRACE corporate bond transaction data for real-time credit market pricing alongside FRED to track the 300 bps threshold.
Keep spread duration shorter than the benchmark index. Don’t dismiss private credit exposure as someone else’s problem.
Disclaimer: This article is for informational purposes only and does not constitute investment advice. Consult a qualified financial advisor before making any investment decisions. Updated: March 2026.