
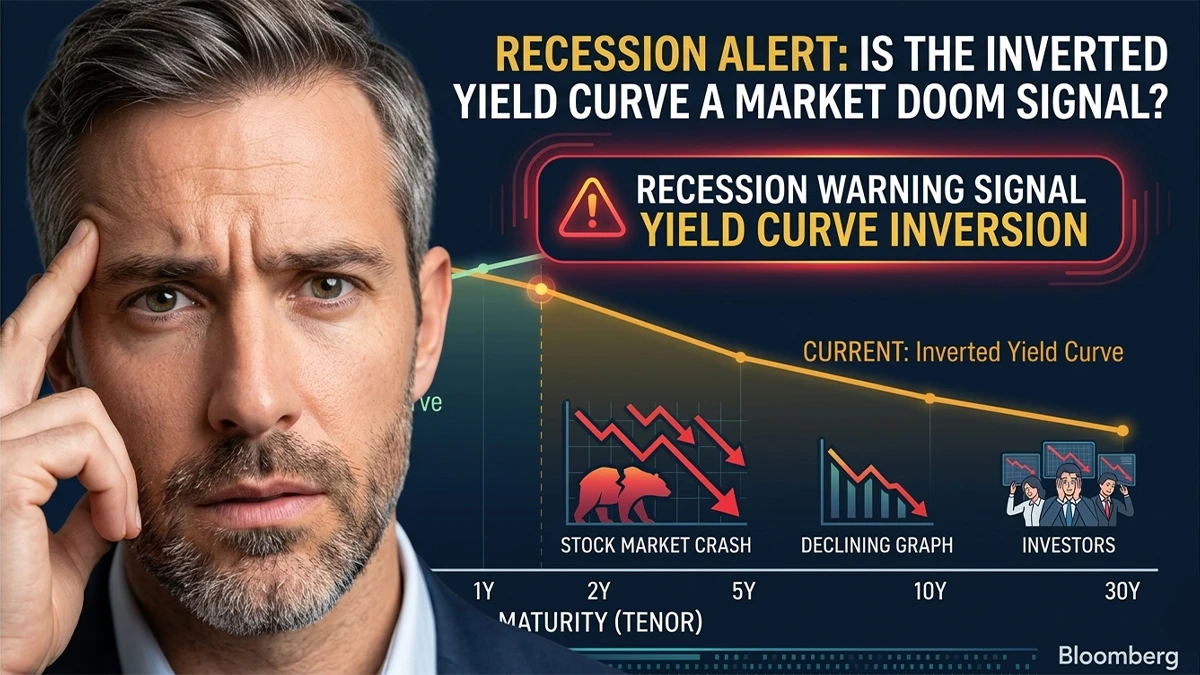
Quick Answer: What Is Yield Curve Inversion and Recessions?
A yield curve inversion happens when short-term Treasury yields climb above long-term yields, the opposite of how bond markets normally behave. It tells you that investors expect the Federal Reserve to cut rates down the road, because they see an economic slowdown coming.
Historical accuracy: Preceded 7 of 8 U.S. recessions since 1955 (87.5%)
Typical lead time: 6–24 months before recession officially begins
Current status (March 2026): The 10Y-3M spread re-inverted in early 2026. The warning clock has restarted.

Yield Curve Inversion and Recessions: Something just happened in the bond market that has not occurred since the 2022–2023 cycle. In February 2026, the 10-year/3-month Treasury spread crossed back into negative territory.
The trigger was the April 2025 tariff shock, and the ripple effect sent investors rushing back into long-dated bonds. Wall Street noticed immediately.
That shift matters more than it might seem. The yield curve inversion has come before 7 of the last 8 U.S. recessions since 1955. That is an 87.5% accuracy rate over 70 years.
It does not mean a recession is guaranteed but when this signal fires, the odds have shifted. Meaningfully.
This guide covers all of it: what yield curve inversion and recessions actually have to do with each other, the full historical record going back to 1955, where things stand right now in 2026, and how to position your portfolio at each stage of the cycle.
What Is Yield Curve Inversion and Recessions? The Mechanics
Start with a simple idea. If you lend money for a longer period, you expect a bigger return. That is basic finance. A 10-year Treasury bond should yield more than a 2-year note because you are locking up your money longer and taking on more uncertainty.
When that logic reverses, when the 2-year yield climbs above the 10-year the curve inverts. It happens because investors are so worried about near-term economic conditions that they pile into long-term bonds for safety.
That surge in demand pushes long-term yields down, while short-term yields stay high because the Fed has not started cutting rates yet.
Put another way: inversion is what happens when fear about the next two years is greater than fear about the next ten.
Normal vs. Inverted: A Simple Comparison
The yield curve moves through three main states. Here is what each one looks like and what it signals:

| Yield Curve State | What It Looks Like | What It Signals |
| Normal (Upward Sloping) | 10-year yields MORE than 2-year | Healthy growth expectations. Investors are rewarded for holding longer-term bonds. |
| Flat | 10-year and 2-year yields nearly equal | A transition phase. Economic uncertainty is starting to build. |
| Inverted (Downward Sloping) | 10-year yields LESS than 2-year | Investors expect rates will fall. A slowdown is being priced in. |
The Two Spreads Investors Track
There are two main yield curve spreads worth knowing. They tell slightly different stories and they do not always move together.
The 10Y-2Y spread: This is what you see quoted most often in financial media. It inverted in July 2022 and normalized by November 2023. It also produced one well-known false positive back in 2019 a five-day inversion that was followed by COVID rather than a classic economic recession.
The 10Y-3M spread: This is the Federal Reserve’s preferred measure and the foundation of the NY Fed’s recession probability model. More sensitive to Fed policy changes, it has predicted every U.S. recession since 1980 with zero false positives. This is also the spread that re-inverted in February–March 2026.
When these two spreads diverge as they are right now the 10Y-3M reading carries more weight for recession forecasting. The Fed’s own model is built on it for a reason.
The Historical Track Record: 8 Inversions Since 1955
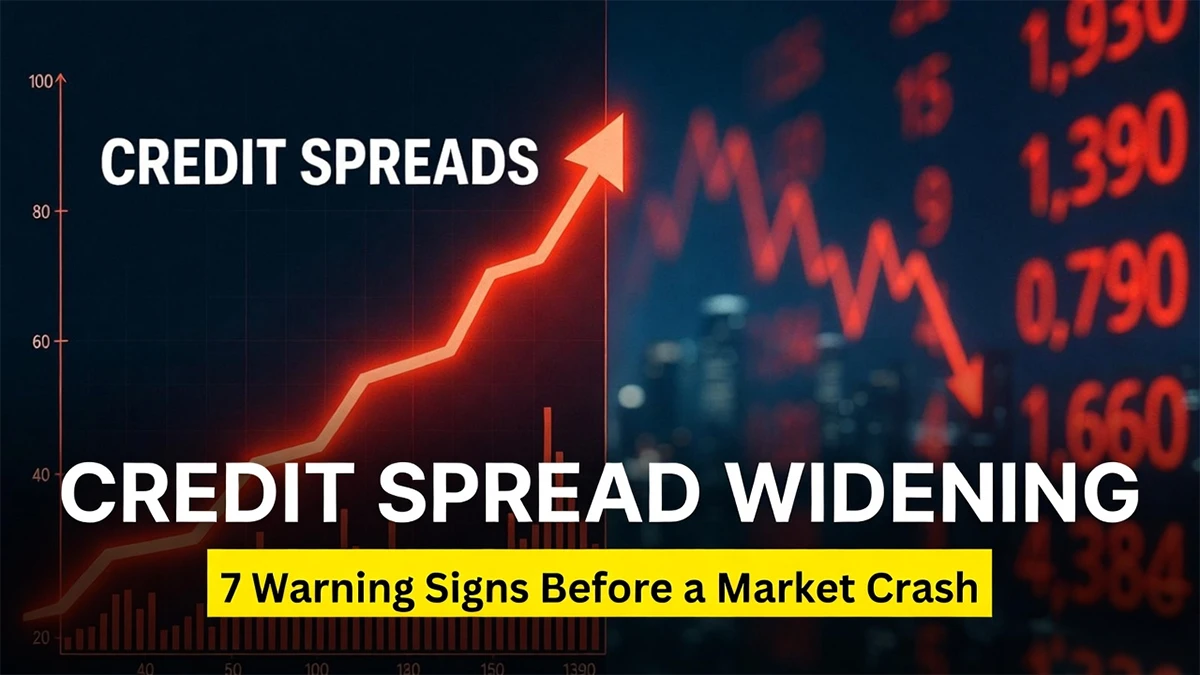
Credit spread widening sends three core messages at once.
The yield curve’s record as a recession predictor is one of the most studied relationships in economics.
San Francisco Fed research puts the average lead time from inversion to recession onset at 12–18 months though the real-world range stretches anywhere from six months to more than two years.
Below is every inversion since 1955, matched against NBER official recession dates:

| Inversion Date | Recession Date | Lead Time | Key Notes |
| 1965–66 | None | False positive | Only an economic slowdown. The one true exception in the modern record. |
| 1973 | Dec 1973 | ~6 months | Oil shock amplified recession severity. |
| 1978–79 | Jan 1980 | ~13 months | Volcker Fed tightening. A double-dip recession followed. |
| 1988–89 | Jul 1990 | ~18 months | Gulf War recession, compounded by the Savings & Loan crisis. |
| 1998–99 | Mar 2001 | ~24 months | Dot-com bust. Longest pre-recession lag on record. |
| 2000 | Mar 2001 | ~13 months | Tech bubble collapse. |
| 2005–06 | Dec 2007 | ~22 months | Global Financial Crisis. Subprime mortgage collapse. |
| Aug 2019 | Feb 2020 | ~6 months | COVID-19. Five-day inversion. Most economists treat this as a false positive. |
| Jul 2022 | No recession as of 2026 | 43+ months (ongoing) | Longest inversion in modern history. AI boom and fiscal stimulus delayed the impact. |
Two things in this data deserve attention. First, duration matters a great deal. Inversions lasting three or more months come with a 73% recession probability.
Shorter ones, under three months, show only 45%. That distinction is critical for reading what is happening in 2026.
Second, the market context during recessions following inversions is consistent: average stock market drawdown of around 20% from peak, followed by roughly 40% recovery gains after the recession trough, for investors who stayed in the market through it.
Do Bond Yields Go Up or Down During a Recession?
Bond yields fall during a recession. As the economy weakens, investors exit equities and buy U.S. Treasuries for safety pushing bond prices up and yields down.
The Federal Reserve cuts interest rates during recessions too, which compresses yields across the entire curve.
The historical numbers back this up clearly. During the 2007–09 Global Financial Crisis, the 10-year Treasury yield dropped from around 5.3% all the way down to 2.1%. That was a textbook flight-to-safety rally. Then in 2020, when COVID hit, the 10-year yield went from 1.9% to just 0.5% in a matter of weeks. The fastest move of that kind in modern history.
What does this mean practically? Investors who hold long-duration Treasury bonds going into a recession have historically enjoyed some of the best risk-adjusted returns available during that period. It is one of the oldest and most reliable defensive plays in the book.
The 2026 Update: Is the Yield Curve Inverting Again?
This is the part most yield curve articles skip, because most were written before it happened. After the 10Y-2Y spread normalized in late 2023 and briefly climbed to +53 basis points by October 2025, something changed in the first quarter of 2026.
The April 2025 tariff shock triggered a genuine growth scare. Investors did what they always do when uncertainty spikes, they moved into long-dated Treasuries.
That surge in demand pushed the 10-year yield lower. Short-term rates stayed elevated because the Fed had not cut aggressively yet.
The gap between them flipped negative. By February–March 2026, the 10Y-3M spread had crossed back into inversion territory for the first time since 2023.

Current Yield Curve Snapshot (March 2026)
| Indicator | Current Status (March 2026) |
| 10Y-2Y Spread | +53 bps as of Oct 2025 → modest re-flattening in Q1 2026 amid tariff uncertainty |
| 10Y-3M Spread | Re-inverted Feb–Mar 2026 (crossed negative) first inversion since 2023 |
| Fed Funds Rate | 4.11% (down from 4.33% peak) cutting cycle underway |
| NY Fed Recession Probability | ~25% chance of recession by November 2026 (March 2026 model) |
| YCharts RPI | 32% as of October 2025 |

Joseph Brusuelas, Chief Economist at RSM, put it plainly: this is exactly what you would expect when investors shift to a much more risk-averse stance because of a growth scare late in the business cycle.
He is right.
The mechanics here are not unusual what is unusual is the timing and the context. Here is the number to watch: if the 10Y-3M spread stays inverted for more than three months, recession probability jumps from 45% to 73%.
That is the duration threshold rule. The clock started in February 2026. Spring 2026 is the key checkpoint.
The Un-Inversion Danger Zone:Why Recession Often Starts After the Curve Normalizes
Most investors fixate on the inversion itself. But the more dangerous moment often comes after it ends. This is the part of yield curve analysis that gets the least attention and causes the most surprises

The Counterintuitive Truth Recessions frequently begin NOT during the inversion but after the yield curve normalizes. When the curve steepens back to positive, it usually means the Fed has started cutting rates in response to deteriorating growth. That cutting cycle is often the signal that recession has either begun or is about to.
Deutsche Bank’s historical research found that in every previous inversion cycle they studied, the yield curve re-steepened before the recession officially started.
CurrentMarketValuation’s model designates the 0–6 months after yield curve normalization as a very high recession risk window not the inversion period itself.
The 2022–2023 inversion is currently the exception to this pattern. The curve normalized in November 2023, and no recession has followed as of early 2026.
Section 6 explains why. But one unusual cycle should not override a pattern that has held across multiple decades and very different economic environments.
The practical implication for investors: normalizing yield curve does not mean ‘all clear.’ Watch for the combination of curve steepening happening at the same time the Fed is actively cutting rates.
That overlap is historically the highest-risk six-month window of the entire economic cycle.
And here is one more thing worth noting. The 2026 re-inversion of the 10Y-3M spread actually extends the warning period. The next time this curve normalizes, that danger window clock will restart from zero.
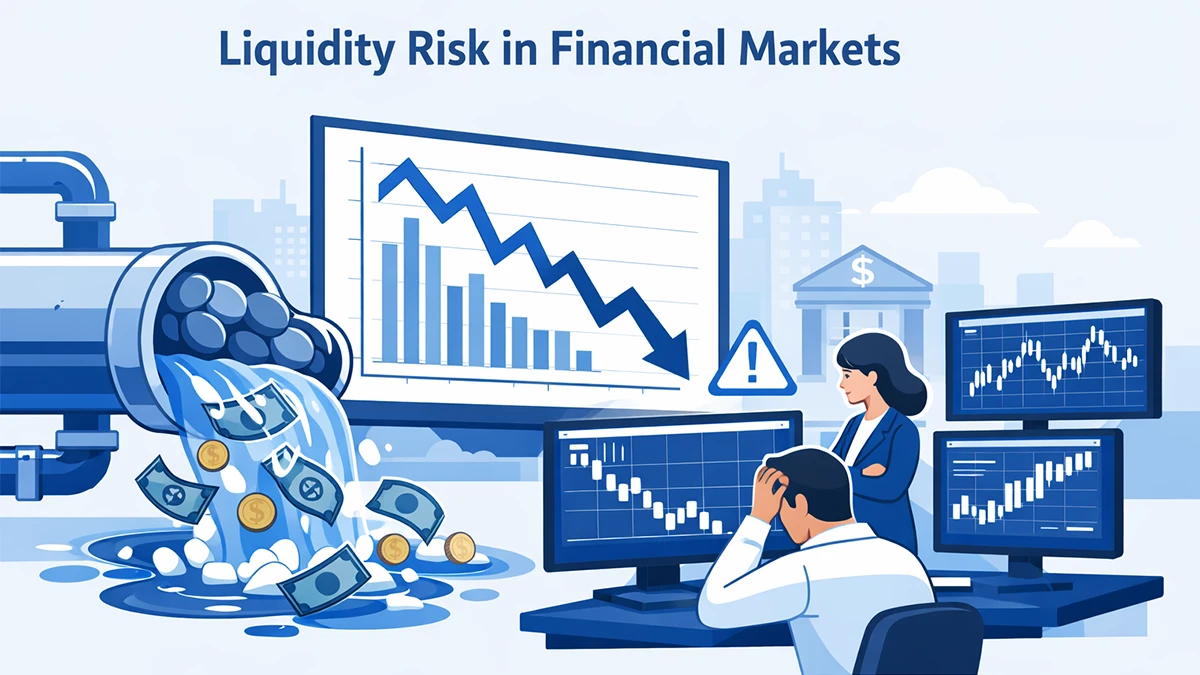
This danger zone is not unique to yield curve signals alone. It reflects a broader pattern of systemic financial risk building beneath the surface, where liquidity conditions, credit spreads, and banking stress indicators all converge at the same time.
Understanding that full risk framework is essential for timing portfolio decisions correctly.
The 2022–2025 Paradox: Why the ‘Most Anticipated Recession’ Never Arrived
Campbell Harvey, the Duke University economist who created the yield curve recession indicator in his 1986 PhD thesis, had a memorable way of describing what happened.
He called 2022–2025 ‘the most anticipated recession in history.’ Everyone saw it coming. Analysts, economists, CFOs. Somehow it never arrived.
Understanding why this happened is not just interesting history. It tells you which structural conditions can delay a recession cycle and which of those conditions may no longer exist heading into 2026.
Five Factors That Delayed the Recession
| Factor | How It Extended the Cycle Despite Inversion |
| Post-COVID fiscal stimulus | Stimulus checks and PPP loans left households with unusually high savings balances. That spending buffer absorbed the shock of rising rates through 2023–24 and kept consumer demand alive longer than models predicted. |
| Locked-in low mortgages | More than 70% of U.S. homeowners had mortgages locked in below 4%. They were effectively shielded from the rate hike cycle. The housing market stalled, but it did not collapse and that made a big difference to consumer net worth. |
| AI infrastructure boom (2024–25) | Corporate capital spending on AI exceeded $600 billion in 2025 alone. That created a private-sector growth engine that offset the drag from high borrowing costs. It was a spending wave that most recession models simply did not anticipate. |
| Preventive corporate layoffs | Companies read the signals early and cut headcount in 2022–23 before the slowdown hit. This softened the eventual employment shock and delayed the labor market deterioration that typically provides the fuel for a recession to accelerate. |
| Strong labor market | Unemployment stayed in the 3.7–4.3% range throughout the inversion period. Consumers kept spending. Recessions need job losses to build real momentum and at scale, those losses never came. |
Looking ahead to 2026, most of those tailwinds have run their course. The stimulus savings are gone. AI capex will eventually plateau.
Locked mortgages remain in place, but that alone is unlikely to hold the line a second time. The structural buffers that absorbed the 2022 inversion may not show up again in the same form.
What Is the Biggest Indicator of a Recession? A 4-Way Comparison
There is no shortage of recession indicators in the financial world. But which ones actually work, which ones just confirm what already happened, and how does the yield curve stack up against the alternatives?
Here is a side-by-side comparison of the four most commonly cited signals.

| Recession Indicator | Lead Time | Accuracy & Limitations |
| Yield Curve Inversion (10Y-3M) | 6–24 months ahead | 87.5% accuracy across 8 recessions since 1955. The best early-warning signal available. Real-time, market-driven data with no reporting lag. One false positive (1966). |
| Unemployment Rate Rise | 0–6 months ahead | Highly accurate but it is a lagging indicator. By the time unemployment spikes visibly, the recession has usually already started. It confirms the cycle, it does not predict it. |
| GDP Negative Growth (2 quarters) | 0 months | This is the definition of a recession, not a warning sign. GDP data arrives with a significant delay and tells you where you have been, not where you are going. |
| Credit Spread Widening | 3–12 months ahead | A strong secondary signal. When corporate bond yields rise sharply relative to Treasuries, it shows stress in lending markets. Works best when used alongside yield curve data. |
| Consumer Confidence Index | 1–6 months ahead | A useful supporting signal. The University of Michigan survey hit an all-time low of 50 in June 2022, right alongside the yield curve inversion a convergence that tends to confirm the risk. |
Verdict: Best Recession Indicator
The yield curve inversion (10Y-3M spread) is the most reliable leading recession indicator available, with an 87.5% accuracy rate since 1955 and a 6–24 month head start. For the highest-confidence signal, watch for all three to converge: yield curve inversion + widening credit spreads + declining consumer confidence. That combination has come before every major U.S. recession since 1980.
How to Invest When the Yield Curve Is Inverted A 3-Stage Playbook
Knowing the yield curve has inverted is only half the equation.
The more valuable question is what to actually do with that information and that answer changes depending on where you are in the cycle. Here is a practical framework built around the three stages of an inversion.

| Stage | Market Condition | Investor Action Framework |
| Stage 1: Inversion Beginning (Curve Just Crossed Negative) | Early warning signal. Economy is still growing. Potential recession is 6–24 months away. | Start trimming high-beta equity positions tech, small caps, and cyclicals tend to suffer most later in the cycle. Build a Treasury bond allocation in the 6–10 year duration range. Step away from bank stocks, which get squeezed when the yield curve works against their profit margins. Rotate toward dividend payers and utilities for income stability. |
| Stage 2: Deep or Prolonged Inversion (3+ Months Inverted) | 73% recession probability triggered. Credit spreads widening. Consumer confidence declining. | Shift equity exposure toward defensive sectors: healthcare, consumer staples, utilities. Increase long-duration Treasury bonds they have historically delivered the best returns during recessions. Cut or eliminate high-yield bond positions as default risk rises. Build a cash reserve so you have the buying power to act when markets hit their lows. |
| Stage 3: Un-Inversion / Normalization (Curve Returns Positive) | Danger zone. This is historically when recession often begins. The Fed is cutting rates. | Hold defensive positioning do not chase any equity rally here. Long-duration Treasuries are at peak value; consider locking in gains selectively. Track employment data closely for confirmation that the cycle is turning. Begin moving back into equities gradually, and only once there is a visible earnings trough to anchor to. |
Safest Investments During a Recession (Direct Answer)
1. U.S. Treasury bonds (especially long-duration, 10–30 year) flight-to-safety demand pushes prices up as yields fall, generating strong total returns
2. TIPS (Treasury Inflation-Protected Securities) protection against stagflation scenarios where inflation stays sticky even as growth slows
3. Dividend-paying defensive stocks (utilities, healthcare, consumer staples) steady cash flows hold up when the broader market does not
4. Cash and money market funds preserve capital and keeps buying power available at market lows
5. Gold, a time-tested hedge in risk-off environments and periods of systemic financial stress
For investors based in India, yield curve signals from the U.S. still matter, because global risk appetite directly affects foreign institutional flows into Indian equity and debt markets.
When U.S. recession probability rises, FII outflows from emerging markets like India tend to accelerate.
Indian investors looking to position defensively may want to review their mutual fund allocation before that shift happens. Financehelpcheck.com has a detailed breakdown of the best mutual funds for 2026 that covers defensive positioning for Indian investors specifically.
8 Common Questions About Yield Curve Inversion
What happens when there is a yield curve inversion?
Do bond yields go up or down during a recession?
Is the yield curve inverting again?
How should you invest when the yield curve is inverted?
How long after yield curve inversion does recession start?
What is the biggest indicator of a recession?
Why do investors pay so much attention to the yield curve?
What are the safest investments during a recession?
Conclusion
The yield curve has been sending recession signals for 70 years. Its track record is not perfect, nothing in economics is, but an 87.5% accuracy rate over that span is about as close to a reliable macro signal as investors are going to find.
Where things stand in March 2026 is clear. The 10Y-3M spread re-inverted in early 2026. The three-month duration clock has restarted.
If that inversion holds through spring, recession probability crosses the 73% threshold. The NY Fed’s own model already puts a 25% chance on recession arriving by November 2026.
The lesson from 2022–2025 is worth holding onto carefully. Fiscal stimulus, AI spending, and locked-in mortgages can delay a recession and did, in spectacular fashion.
But those tailwinds are largely spent now. The same structural backstops that absorbed the last inversion are not lined up the same way heading into this one.
One principle stands above everything else in this guide: recessions tend to begin after the yield curve normalizes, not during the inversion itself.
By the time recession is officially declared by the NBER, the best defensive trades are already in the rearview mirror. Stage 1 action. While the economy still feels normal is where thoughtful investors make their moves.
Keep watching the 10Y-3M spread. Note the duration. And pay close attention to what happens the next time this curve turns positive.
Disclaimer: This article is for informational purposes only and does not constitute investment advice. Consult a qualified financial advisor before making investment decisions based on economic indicators. Data sourced from the Federal Reserve (FRED), NY Fed, NBER, and YCharts. Updated March 2026.