

Credit cycles explained simply: they are the engine behind almost every major boom and bust in modern economic history. When banks lend freely, the economy grows. When they pull back, it contracts. Everything else, from stock markets to real estate to your own loan rates, follows this rhythm.
If you understand where the credit cycle stands right now, you’re already ahead of most investors.
Quick Answer: What Is a Credit Cycle?
Credit cycles explained at their core: they are the natural expansion and contraction of credit availability in an economy over time.
Banks loosen lending standards, credit flows easily, growth picks up. Then risk builds, defaults rise, banks tighten standards, and credit dries up. That full journey is one credit cycle.
It sounds simple. But the timing, scale, and consequences of each turn have shaped every major financial crisis in the last 100 years.
What Is a Credit Cycle in Economics?
Credit cycles explained in economics means understanding how the supply of credit moves through periods of expansion and contraction, driven by bank behavior, interest rates, and the broader economy.
During expansion, banks compete aggressively for borrowers. Loan terms get easier, rates drop, and money is available to almost anyone who asks. Asset prices rise.
During contraction, banks do the opposite. They raise standards, cut credit lines, and call in risky loans. Borrowers who relied on cheap credit suddenly can’t refinance. Prices fall.
And the cycle starts again.
The credit cycle doesn’t move in isolation. It feeds directly into systemic stress in the financial system. When credit contracts sharply, it can trigger bank failures, asset crashes, and full economic recessions. Systemic financial risk and how a single credit shock spreads across the entire financial system explains exactly how that contagion works.
The 4 Main Phases of the Credit Cycle

1. Expansion Phase
Banks are lending. Rates are low. Businesses borrow to grow, households borrow to buy homes, and investors borrow to buy assets.
GDP rises. Employment improves. Everyone feels good about the outlook.
This phase can last years. The 2003 to 2007 cycle in the US ran for nearly four years of pure expansion before it broke.
2. Peak Phase
Here’s where it gets dangerous.
Credit has been flowing for so long that standards slip badly. Banks lend to riskier borrowers. Asset prices have risen so far that they no longer reflect real value. Everyone assumes the good times will continue.
Leverage is at its highest point. Any shock to confidence can start the reversal.
3. Contraction Phase
A trigger hits. It could be a rate hike, a default, a regulatory action, or just the weight of accumulated risk.
Banks pull back hard. Lending standards tighten fast. Businesses can’t roll over their debt. Asset prices fall as forced sellers enter the market. Defaults rise, which causes banks to tighten further.
This is the phase that most people recognize as a financial crisis.
4. Trough Phase
The deleveraging is mostly done. The weakest borrowers have defaulted. Banks have taken their losses and rebuilt some capital.
Lending is still tight, but the rate of tightening has stopped. The economy stabilizes at a lower level. This is where recovery quietly begins, usually before anyone notices.
What Causes Credit Cycles?
Credit cycles don’t appear from nowhere. Several forces drive each turn.
Interest Rate Changes
When central banks cut rates, borrowing gets cheaper. Demand for loans rises, banks compete for customers, and credit expands. When rates rise, the opposite happens.
The Fed’s rate decisions since 2022 showed this in real time. Rates went from near zero to 5.25%-5.5% in 18 months. Credit conditions tightened sharply across mortgage, corporate, and consumer lending markets.
Lending Standards
Banks have more discretion than most people realize. Even at the same interest rate, a bank can decide to tighten or loosen who it lends to, how much collateral it requires, and what covenants it imposes.
When banks collectively loosen standards, credit expands faster than rates alone would suggest. When they tighten, credit can contract even without a rate change.
Borrower Demand
Low demand dampens credit expansion even when rates are low. Japan spent most of the 1990s with near-zero rates, but borrowers didn’t want to borrow after the 1989 asset bubble burst. The credit cycle stayed depressed for over a decade.
Economic Conditions
Strong economic growth encourages borrowing and lending. Recession expectations do the opposite. Borrowers don’t want new debt if they expect income to fall. Lenders don’t want to extend credit if they expect defaults to rise.
Central Bank Policies
Beyond rate setting, central banks use quantitative easing (QE) to inject liquidity directly into credit markets. The Fed’s QE programs in 2009 and 2020 helped restart credit expansion after major contractions.
Regulation also matters. Basel III’s capital adequacy requirements, introduced after 2008, directly shape how much banks can lend at any point in the cycle. Capital Adequacy Ratio (CAR) Explained for Investors breaks down exactly how these buffers work and why they matter for market stability.
Key Indicators of the Credit Cycle
This section is the real value in any credit cycles explained guide. Knowing the phases is useful. Knowing how to spot where you are in real time is what actually helps investors.

Credit Growth
Track total bank credit as a percentage of GDP. When it’s growing faster than the economy, you’re likely in expansion or peak. When it’s shrinking, contraction is in play.
The BIS tracks this data for over 40 countries. A credit-to-GDP ratio rising more than 10 percentage points above its long-run trend is one of the most reliable early warning signs of a coming crisis. See the BIS credit-to-GDP early warning indicator methodology.
Loan Default Rates
Rising defaults are the clearest signal that the cycle is turning. Watch bank non-performing loan (NPL) ratios. When NPLs rise quarter on quarter, contraction is either underway or very close.
In the US, the FDIC publishes quarterly data on bank loan performance. Track it via the FDIC quarterly banking profile.
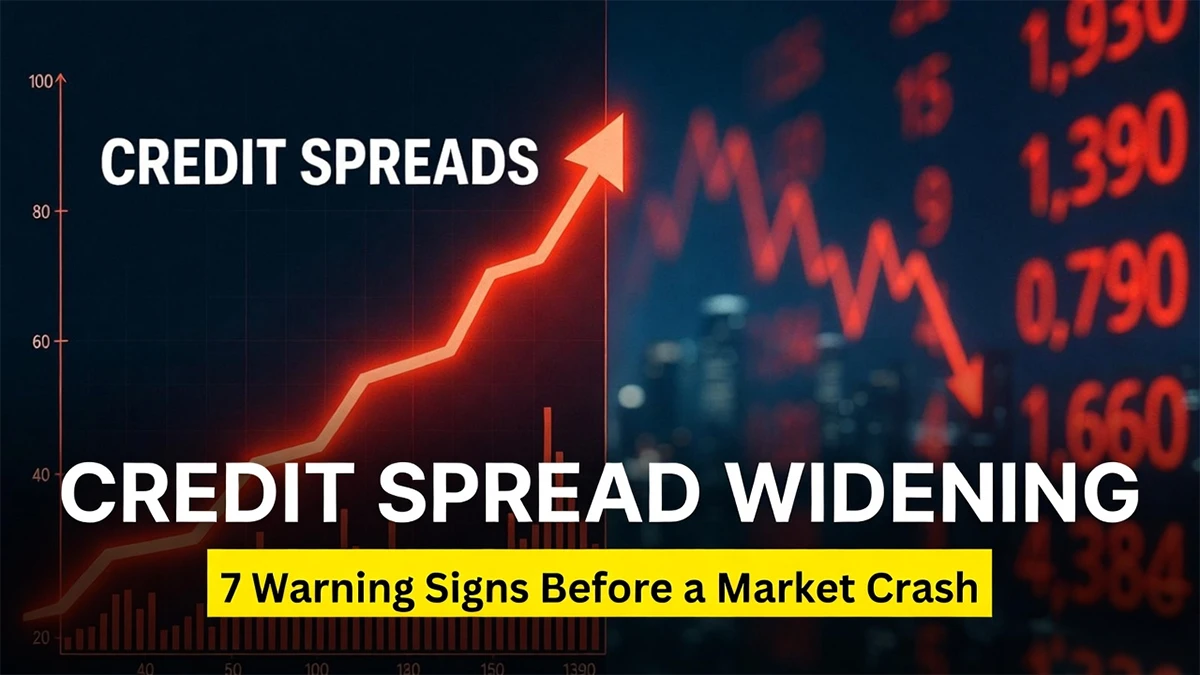
Credit Spreads
Credit spreads are the difference between yields on corporate bonds and government bonds. Tight spreads mean investors are comfortable taking credit risk. Wide spreads mean fear is rising.
When spreads widen fast, it signals the market is pricing in higher default risk. It’s one of the most real-time indicators of where the credit cycle stands. What Credit Spread Widening Signals for Global Markets goes deeper on how to read this signal before it shows up in broader economic data.
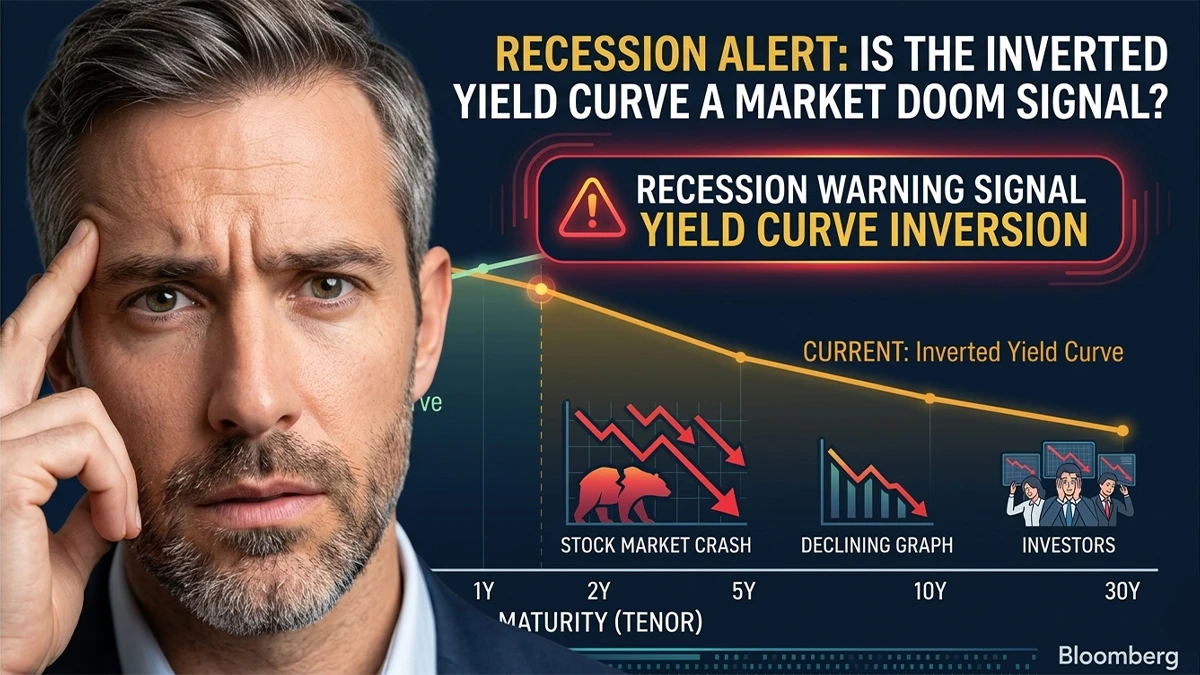
Yield Curve
An inverted yield curve (short-term rates higher than long-term rates) has preceded every US recession since 1955. It signals that the market expects the central bank to cut rates in the future because growth is about to slow.
It’s also a direct signal that credit conditions will tighten. Banks borrow short and lend long. An inverted curve squeezes their margins and reduces their incentive to lend. Yield Curve Inversion and Its Impact on Recessions covers the historical record and what it means for the current cycle.
Lending Standards
The US Federal Reserve publishes the Senior Loan Officer Opinion Survey (SLOOS) quarterly. It directly asks banks whether they are tightening or easing standards. When a majority of banks report tightening, the contraction phase is starting or accelerating. Access it via the Federal Reserve Senior Loan Officer Opinion Survey.
Credit Cycle vs Business Cycle

People often confuse the two. They’re related but not the same thing.
| Feature | Credit Cycle | Business Cycle |
|---|---|---|
| Focus | Lending and borrowing | Economic output (GDP) |
| Driven by | Banks and financial institutions | Macroeconomy broadly |
| Impacts first | Asset prices and financial markets | Employment and production |
| Lead time | Can lead business cycle by 1-2 years | Typically 5-10 year span |
| Key metric | Credit growth, spreads, NPLs | GDP growth, unemployment |
The credit cycle often leads the business cycle. Credit problems show up in financial markets before they show up in employment and GDP data.
The 2008 crisis is the clearest example. Credit markets seized up in mid-2007. The official US recession didn’t start until December 2007. GDP didn’t show major damage until 2008.
How Credit Cycles Affect Financial Markets
Stock Markets
In the expansion phase, cheap credit fuels corporate earnings growth and buybacks. Stocks rise.
In contraction, earnings fall as credit costs rise and demand slows. Companies that relied on debt for growth get hit hardest. The S&P 500 fell about 57% from October 2007 to March 2009 as the credit contraction played out in full.
Bond Markets
Corporate bond prices fall as credit spreads widen during contraction. Government bond prices typically rise (yields fall) as investors seek safety.
High-yield (junk) bonds are the most sensitive to credit cycle turns. They’re the first to sell off and the last to recover.
Real Estate Markets
Property markets depend on mortgage credit availability more than almost any other asset class. When credit expands, property prices rise. When it contracts, prices fall and transaction volumes collapse.
US home prices rose over 80% between 1997 and 2006 during one of the longest credit expansions in history. They then fell about 30% in the contraction that followed.
Capital Markets
IPO activity, corporate bond issuance, and leveraged lending all contract sharply when the credit cycle turns. Companies that needed to access capital markets during contraction either paid far higher rates or couldn’t access markets at all.
Role of Central Banks in Credit Cycles
Central banks are the single most powerful force in shaping credit cycle duration and severity.
Interest rate policy is the primary lever. Rate cuts extend expansions. Rate hikes shorten them and can trigger contractions if the hiking cycle is too fast or too far.
Quantitative easing bypasses the banking system entirely. The Fed bought over $4 trillion in assets after 2008 and another $3 trillion in 2020. This injected liquidity directly into credit markets, restarting lending when banks were too scared to move.
Liquidity support through emergency lending facilities (like the Fed’s discount window and the Bank Term Funding Program in 2023) prevents credit contractions from becoming full system collapses.
Financial regulation shapes how much risk banks can carry at each phase. Higher capital requirements slow expansion but reduce contraction severity. Looser regulation does the opposite.
Scratch that. The regulation point is actually the most underappreciated one. Every major credit bust in modern history has a regulatory failure somewhere in its origins. 2008 was not primarily a rate problem. It was a supervision problem.
Knowing which bank stress metrics to track before a contraction hits is one of the most practical skills an investor can build. Banking Stress Indicators Every Investor Should Monitor covers exactly which numbers to watch and what thresholds matter.
Real World Examples of Credit Cycles

2008 Global Financial Crisis
The textbook credit cycles explained case. US credit expanded aggressively from 2003 to 2007. Mortgage lending standards collapsed. Subprime loans were bundled into securities and sold globally.
When defaults rose in late 2006, the cycle began its violent turn. By September 2008, Lehman Brothers had failed with $613 billion in liabilities. Global credit markets froze. The contraction phase played out across every major economy simultaneously.
Dot-Com Bubble (1995-2001)
The dot-com era was partly a credit cycle story. Venture capital and equity markets substituted for traditional bank credit. When the bubble burst in 2000, funding for tech companies dried up almost overnight.
But because traditional bank lending wasn’t as deeply contaminated as in 2008, the damage to the broader credit system was contained. The recession was real but shorter.
COVID Credit Expansion (2020-2022)
Governments and central banks responded to COVID with the largest coordinated credit expansion in history. US M2 money supply grew about 40% in two years. Corporate credit spreads, which briefly spiked in March 2020, collapsed within weeks as the Fed intervened in 10 market segments in three weeks.
The result was an artificial extension of the cycle. The contraction that would normally have followed COVID didn’t arrive until 2022-2023, when rate hikes finally caught up with the expansion. How that liquidity shock spread through global markets is part of the broader systemic risk picture.
How Investors Use Credit Cycle Analysis

Early Expansion Strategy
This is the best time to take risk. Credit is becoming available again. Asset prices are depressed. Spreads are wide but narrowing.
Equities, high-yield bonds, and property all tend to outperform from trough to mid-expansion.
Late Cycle Strategy
Reduce risk gradually. Shorten bond duration. Shift equity exposure from cyclical sectors (banks, industrials) to defensive sectors (utilities, healthcare).
Watch credit spreads for the first sign of widening. That’s usually the earliest reliable signal.
Contraction Strategy
Capital preservation. Government bonds outperform as investors flee risk. Cash has real value when asset prices are falling. Avoid high-yield debt and leveraged companies.
Recovery Strategy
Start rebuilding risk exposure before the all-clear is obvious. The best returns come in the first 12 months of recovery, when most investors are still waiting for proof the worst is over.
Credit Cycle Impact on the Economy
The credit cycle is not just a financial market story. It shapes the real economy.
Economic growth rises and falls with credit availability. Consumer spending, business investment, and housing construction all depend on access to credit.
Inflation often rises during credit expansion as more money chases the same goods. It falls during contraction as demand drops.
Employment lags the credit cycle. Job losses peak after credit has already contracted. Job creation in recovery starts before most people feel it.
Financial stability is directly tied to where the cycle stands. The most dangerous point is the late expansion and peak, when leverage is highest and confidence has masked the underlying fragility.
Warning Signs of Credit Cycle Turning
These signals don’t all fire at once. But when three or more appear together, the turn is likely close.
- Lending standards tightening across multiple bank surveys
- Credit spreads widening on high-yield bonds for two or more quarters
- Loan default rates rising quarter on quarter
- Yield curve inverting or flattening sharply
- Asset prices rising faster than underlying earnings or rents
- Central bank shifting from easing to tightening
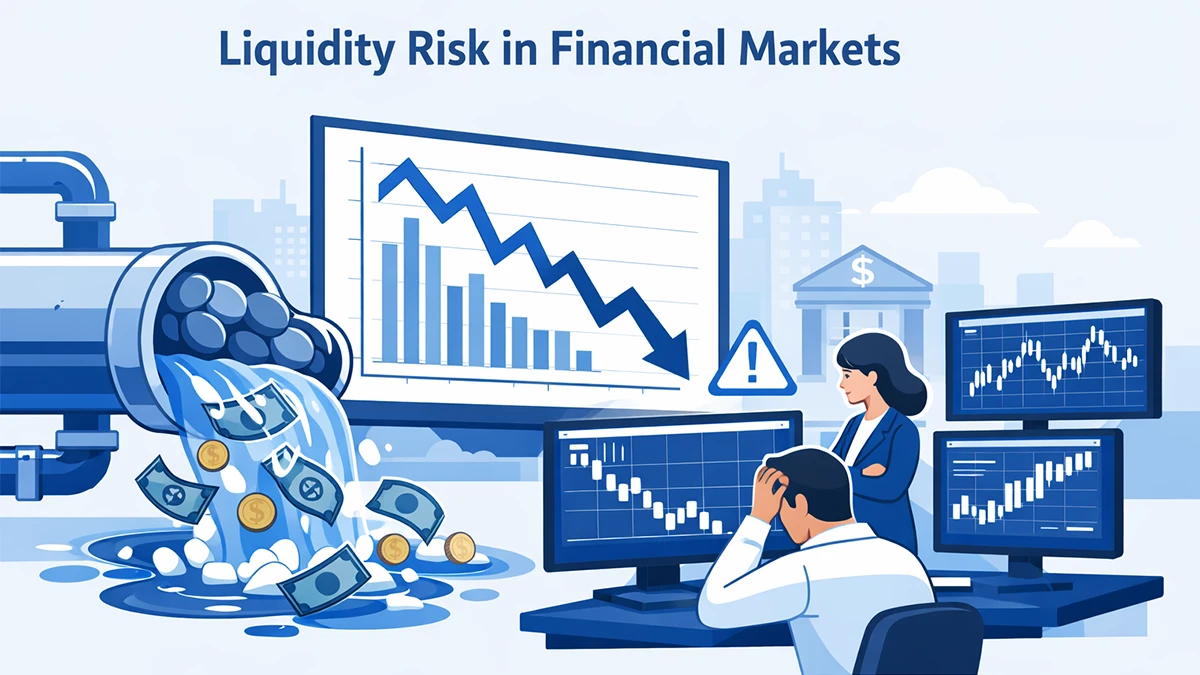
- Falling liquidity in interbank lending markets
The 2007 peak showed six of these seven signals simultaneously. Most observers missed it because the expansion had been so long and so comfortable.
Key Takeaways
- A credit cycle moves from expansion to peak to contraction to trough. Each phase has clear market signals.
- The credit cycle leads the business cycle by 1-2 years. Credit problems hit financial markets before GDP and employment.
- Key real-time indicators: credit spreads, loan default rates, lending standards surveys, and the yield curve.
- Central banks can extend or dampen cycle phases but cannot eliminate them.
- Investor strategy should change meaningfully across phases: risk-on in early expansion, defensive in late cycle, capital preservation in contraction.
Frequently Asked Questions
What are the 4 stages of the credit cycle?
What causes credit cycles?
How do credit cycles affect financial markets?
What is the difference between the credit cycle and the business cycle?
How can investors use credit cycle analysis?
What is the credit-to-GDP warning threshold?
Bottom Line
Credit cycles are the hidden engine driving markets, economies, and your own financial opportunities. The investor who understands which phase we’re in doesn’t need to predict the future—they just need to position appropriately for the phase that’s already here. Watch the indicators, respect the cycle, and let the rhythm of credit work for you instead of against you.
Disclaimer: This article is for educational purposes only and does not constitute financial advice. Credit cycle analysis is one tool among many, and all investment decisions should be made based on your personal financial situation and risk tolerance.